Skip to content
Doc2X

A picture of a figure in, TikZ out.

Give Doc2X a PNG, JPG or WebP of a diagram: a geometry figure, an automaton, a plot, a block diagram. It comes back as an SVG that stays sharp at any size and, where it can be had, as TikZ for your paper: a circle is a circle with a radius, an arrow is an arrow, and the labels are text you can change.

Vectorize a figure

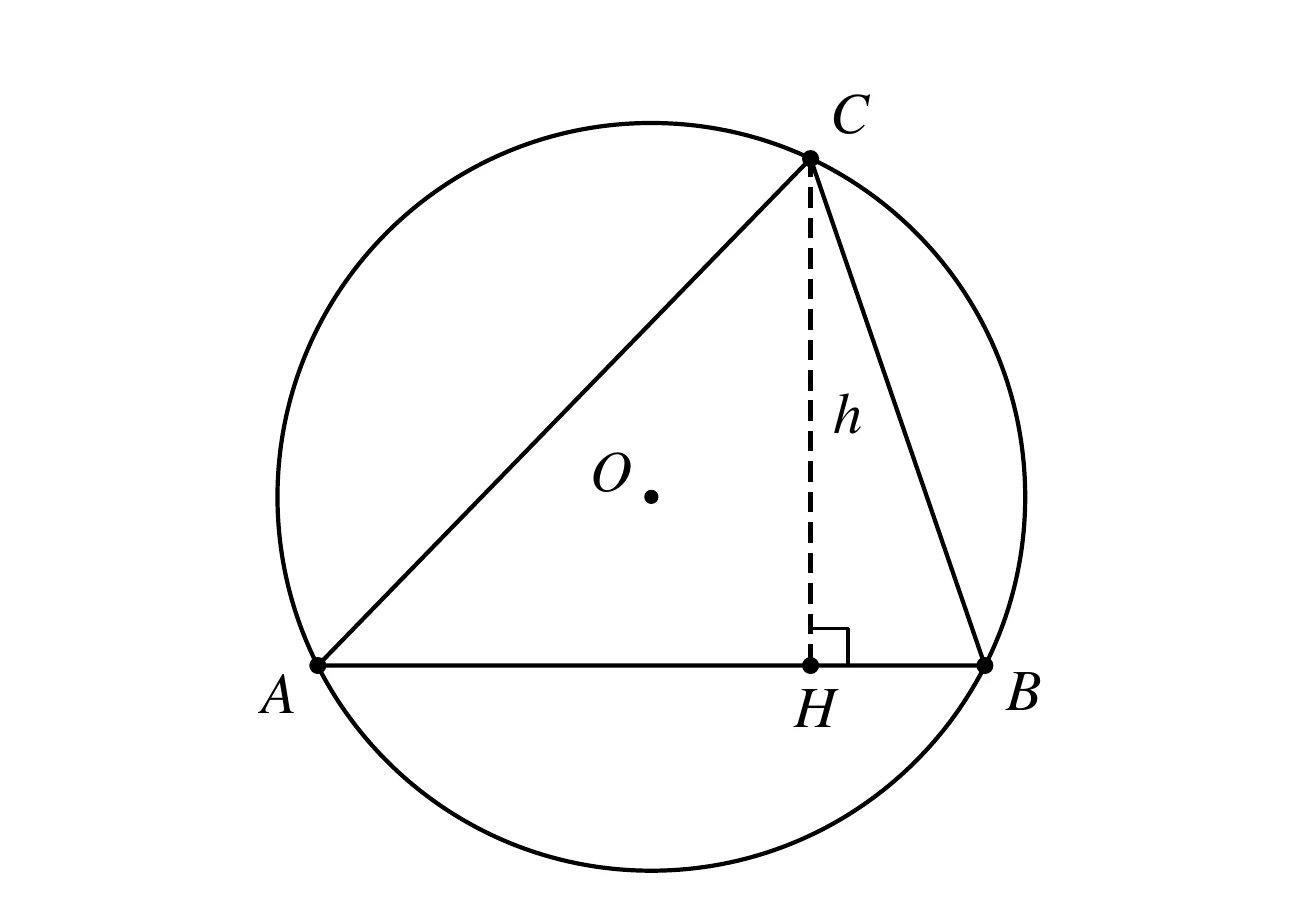
A triangle in its circle, as the TikZ that came back for a picture of it draws it.
The TikZ that came back, compiledFrom a PNG of 900 × 620
From
A PNG, JPG or WebP, up to 20 MB
Back
SVG and TikZ; EPS or PNG if you want them
Cost
3 credits a picture
Open the vectorizer

Free plan: 50 credits every month, no card needed. That is 16 figures.

Nothing at hand? See four figures and the TikZ each came back as

From
A PNG, JPG or WebP of a drawing, chart or diagram, up to 20 MB
Back
An SVG and, where it can be had, TikZ; an EPS and a PNG from the same page
Cost
3 credits a picture, charged when the drawing is done

Four figures, and their TikZ

What went in, and what the code draws.

Four figures of the kind a paper or a lecture has. Each was saved as a PNG and vectorized once. Each is shown twice: first the picture that went in, then the TikZ that came back, compiled with nothing changed. Open the code under each to read it.

  • 01All four files compiled as they came, with pdflatex.
  • 02All 30 labels in the pictures came back as text: letters in math mode, digits, two words, the subscripts of three states.
  • 03They are not flawless: under each figure is what differs from its picture.
  1. 01A triangle in its circle

    17.8 s 3 credits 6 labels as text
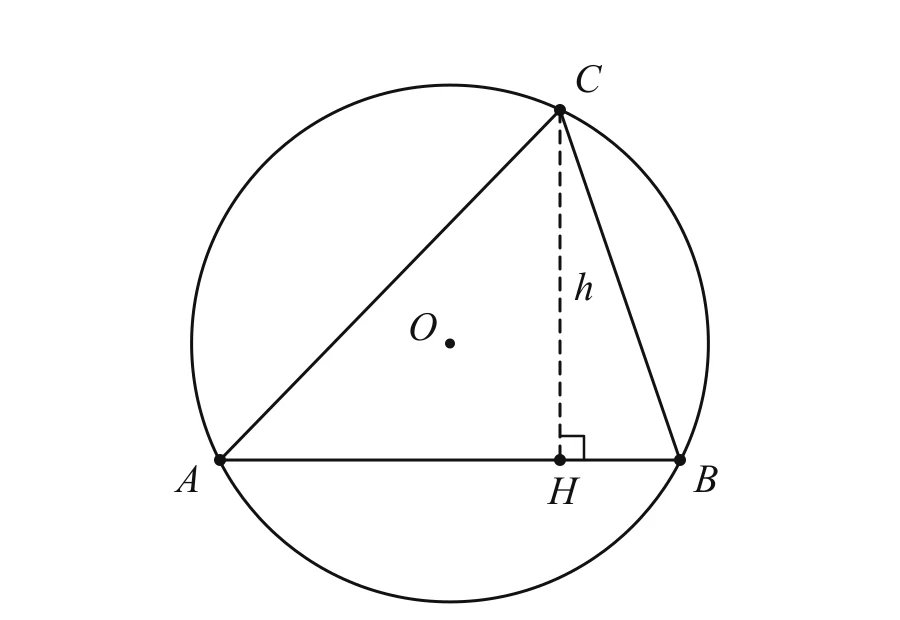
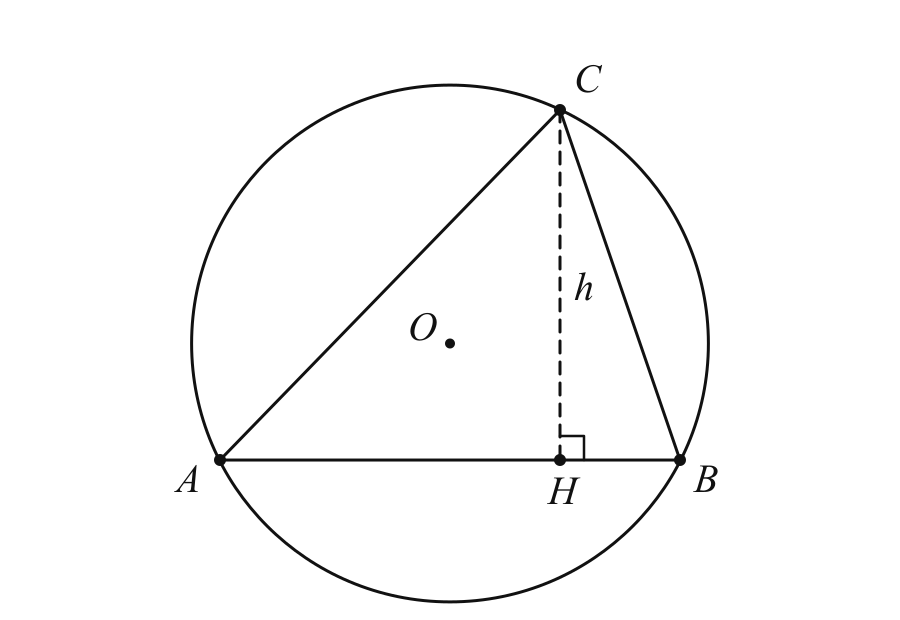
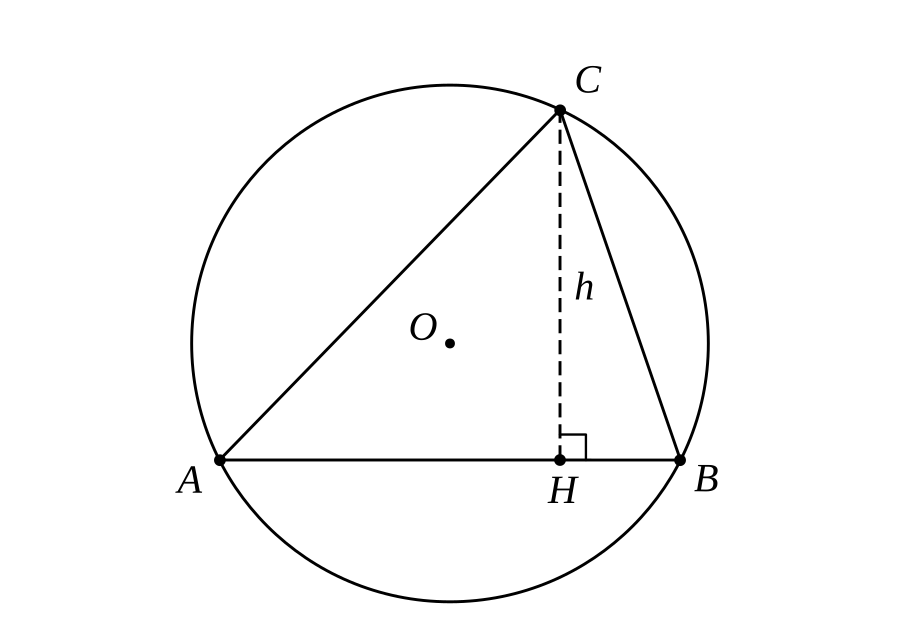
    A triangle in its circle: the picture that went in, a PNG of 900 by 620 pixels.
    Went in PNG, 900 × 620
    A triangle in its circle: the TikZ that came back, compiled with pdflatex.
    Came back the TikZ, compiled

    What differs. Nothing we can see: every line, the dashed height, the right angle and the six labels are where they were.

    The TikZ, as it came: 25 lines
    \begin{tikzpicture}[line cap=round, line join=round, line width=0.76pt,
      lbl/.style={inner sep=0pt, outer sep=0pt, anchor=base west, font=\fontsize{10.5}{12.6}\selectfont,
        execute at begin node={\thinmuskip=0mu\medmuskip=0mu\thickmuskip=1mu}}]
    \path[use as bounding box] (0,0) rectangle (8.272,5.695);
    \coordinate (C) at (5.147,4.688);
    \coordinate (A) at (2.018,1.469);
    \coordinate (B) at (6.254,1.469);
    \coordinate (H) at (5.147,1.469);
    \coordinate (O) at (4.136,2.54);
    \draw (C) -- (A) -- (B) -- cycle;
    \draw[dash pattern=on 3.71pt off 1.79pt, dash phase=0.3pt, line cap=butt] (C) -- (H);
    \draw (O) circle[radius=2.374];
    \fill (C) circle[radius=0.054];
    \fill (O) circle[radius=0.045];
    \fill (A) circle[radius=0.054];
    \fill (H) circle[radius=0.054];
    \fill (B) circle[radius=0.054];
    \node[lbl] at (5.278,4.847) {$C$};
    \node[lbl] at (1.632,1.167) {$A$};
    \node[lbl] at (6.378,1.182) {$B$};
    \node[lbl] at (5.037,1.074) {$H$};
    \node[lbl] at (5.279,2.943) {$h$};
    \node[lbl] at (3.754,2.575) {$O$};
    \draw[line width=0.61pt] (5.147,1.703) -- (5.385,1.703) -- (5.385,1.469);
    \end{tikzpicture}

    The files: the picture, the TikZ (1,312 bytes) and the SVG (2,128 bytes).
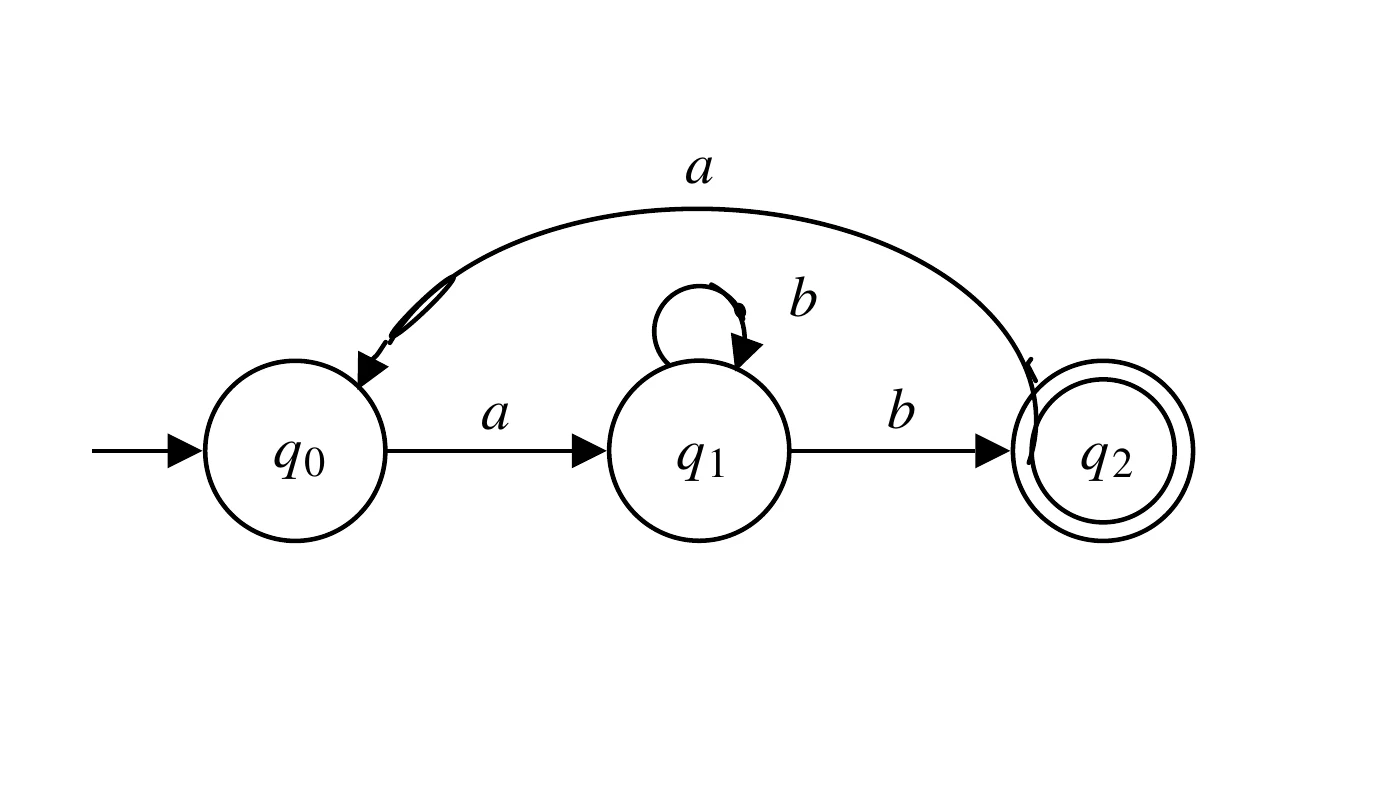
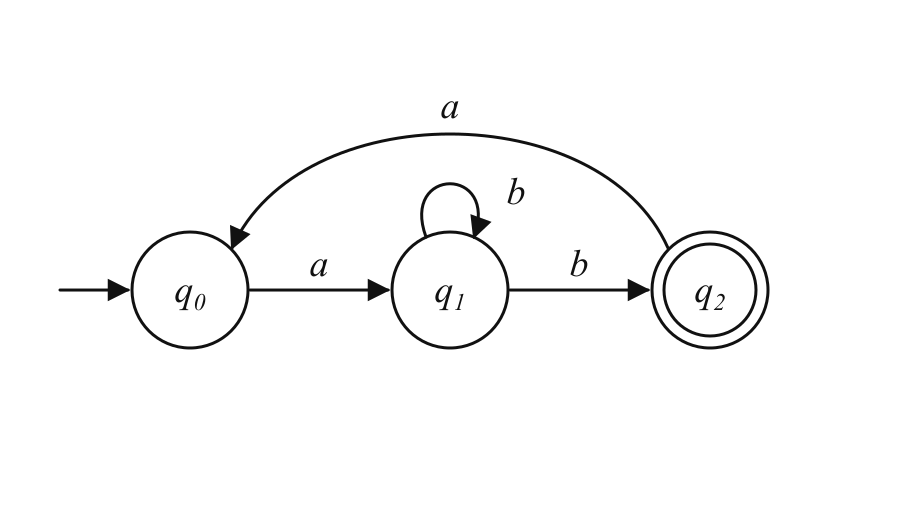
  2. 02An automaton with three states

    15.1 s 3 credits 7 labels as text

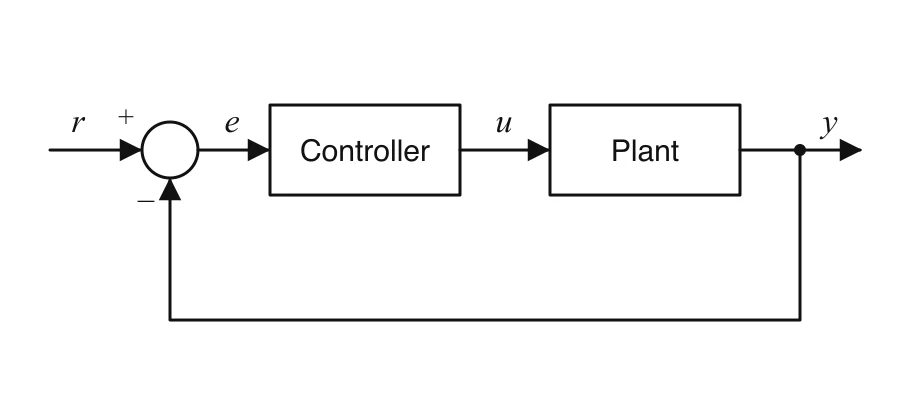
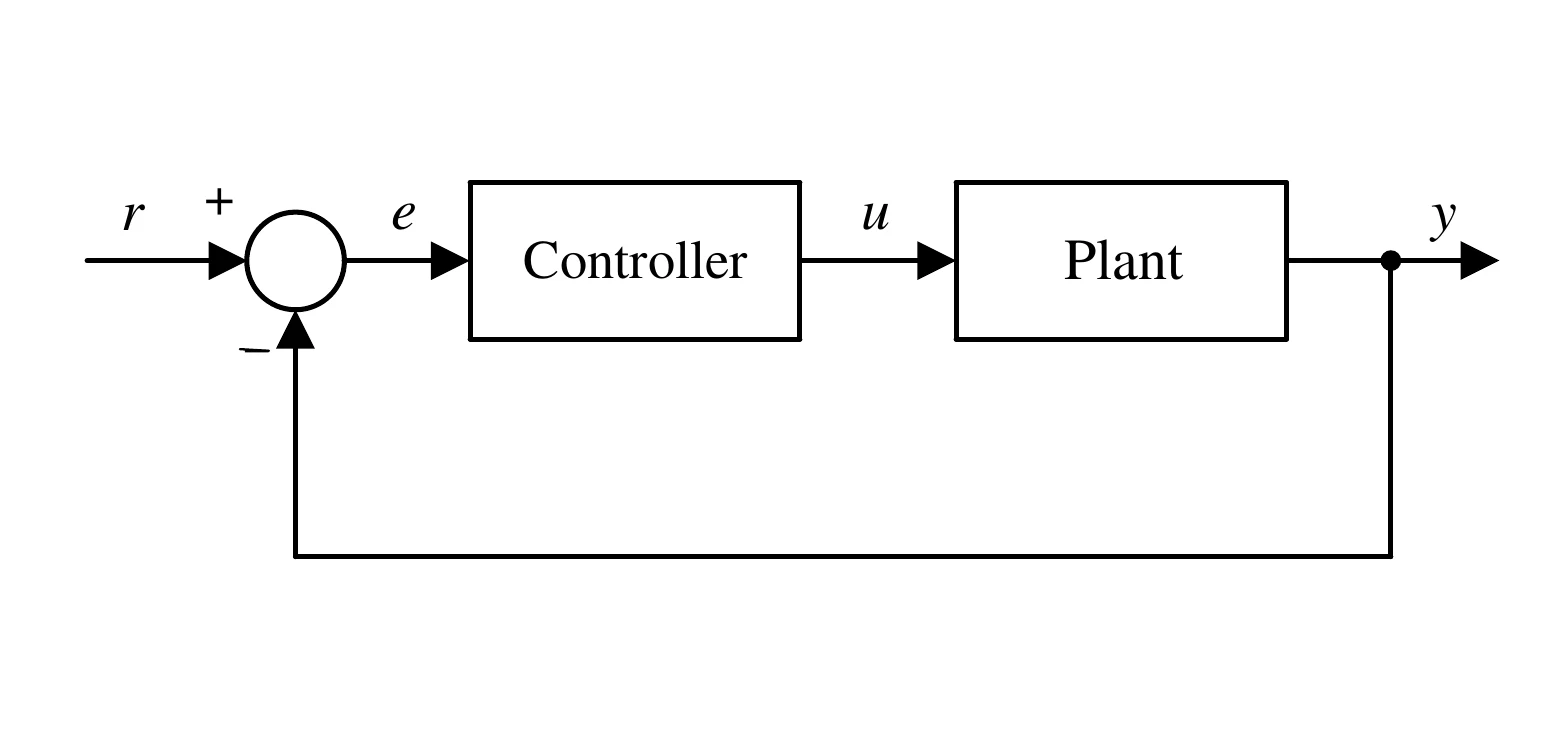
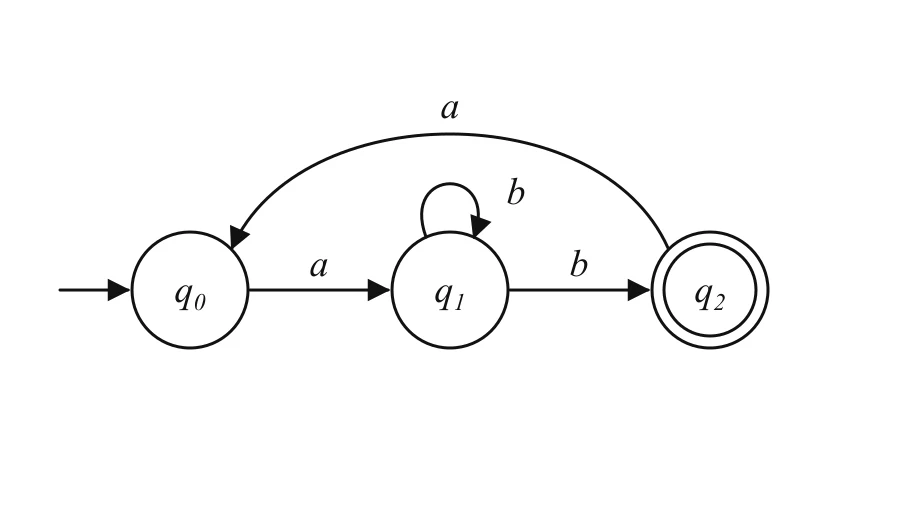
    An automaton with three states: the picture that went in, a PNG of 900 by 520 pixels.
    Went in PNG, 900 × 520
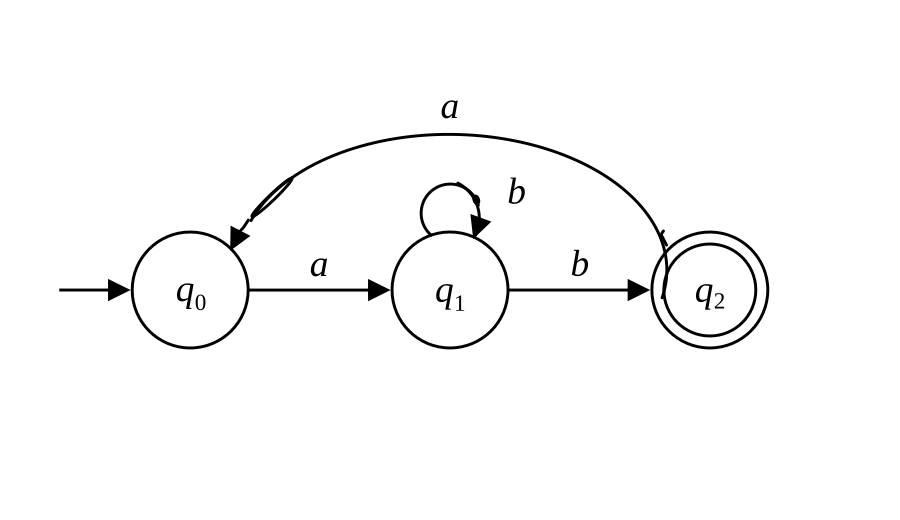
    An automaton with three states: the TikZ that came back, compiled with pdflatex.
    Came back the TikZ, compiled

    What differs. Two of the curved arrows carry a short stray stroke beside their heads, and the long arc ends in a small hook where it leaves the last state.

    The TikZ, as it came: 28 lines
    \begin{tikzpicture}[line cap=round, line join=round, line width=0.82pt, >={Triangle[length=6.3pt, width=6.3pt, line width=0pt]},
      lbl/.style={inner sep=0pt, outer sep=0pt, anchor=base west, font=\fontsize{10.5}{12.6}\selectfont,
        execute at begin node={\thinmuskip=0mu\medmuskip=0mu\thickmuskip=1mu}}]
    \path[use as bounding box] (0,0) rectangle (8.879,5.133);
    \draw[->, line cap=butt] (5.012,2.27) -- (6.415,2.27);
    \draw[->, line cap=butt] (2.447,2.27) -- (3.853,2.27);
    \draw[->, line cap=butt] (0.583,2.27) -- (1.286,2.27);
    \draw (4.44,2.271) circle[radius=0.572];
    \draw (1.875,2.27) circle[radius=0.572];
    \draw (7.005,2.27) circle[radius=0.454];
    \draw (7.004,2.27) circle[radius=0.572];
    \draw[rotate around={-1.11:(4.467,2.493)}] (2.467,2.917) arc[start angle=161.15, delta angle=-172.5, x radius=2.113, y radius=1.314];
    \draw[rotate around={-70.84:(4.699,3.161)}] (4.699,3.161) ellipse[x radius=0.038, y radius=0.022];
    \draw[rotate around={43.81:(2.682,3.185)}] (2.682,3.185) ellipse[x radius=0.274, y radius=0.03];
    \fill (4.669,2.774) -- (4.641,3.021) -- (4.848,2.946) -- cycle;
    \fill (2.27,2.658) -- (2.274,2.906) -- (2.469,2.805) -- cycle;
    \draw (4.251,2.813) arc[start angle=-131.57, delta angle=-212.59, radius=0.288];
    \draw (4.517,3.326) arc[start angle=62.81, delta angle=-87.59, radius=0.39];
    \node[lbl] at (5.004,3.123) {$b$};
    \node[lbl] at (4.347,3.969) {$a$};
    \node[lbl] at (3.055,2.408) {$a$};
    \node[lbl] at (5.628,2.412) {$b$};
    \node[lbl] at (4.29,2.154) {$q_{1}$};
    \node[lbl] at (1.731,2.162) {$q_{0}$};
    \node[lbl] at (6.857,2.154) {$q_{2}$};
    \draw (2.367,2.818) .. controls (2.37,2.829) and (2.363,2.842) .. (2.367,2.853) .. controls (2.368,2.855) and (2.391,2.875) .. (2.392,2.877) .. controls (2.413,2.903) and (2.43,2.934) .. (2.449,2.961);
    \draw (6.577,2.714) .. controls (6.564,2.74) and (6.55,2.765) .. (6.538,2.791) .. controls (6.533,2.8) and (6.523,2.81) .. (6.525,2.821) .. controls (6.526,2.825) and (6.544,2.849) .. (6.547,2.853);
    \end{tikzpicture}

    The files: the picture, the TikZ (2,264 bytes) and the SVG (4,015 bytes).

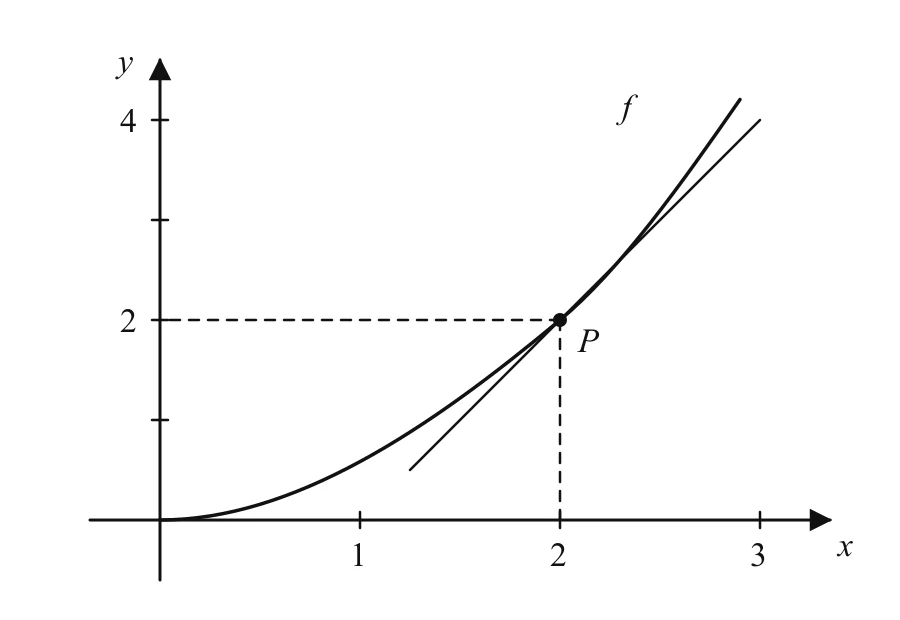
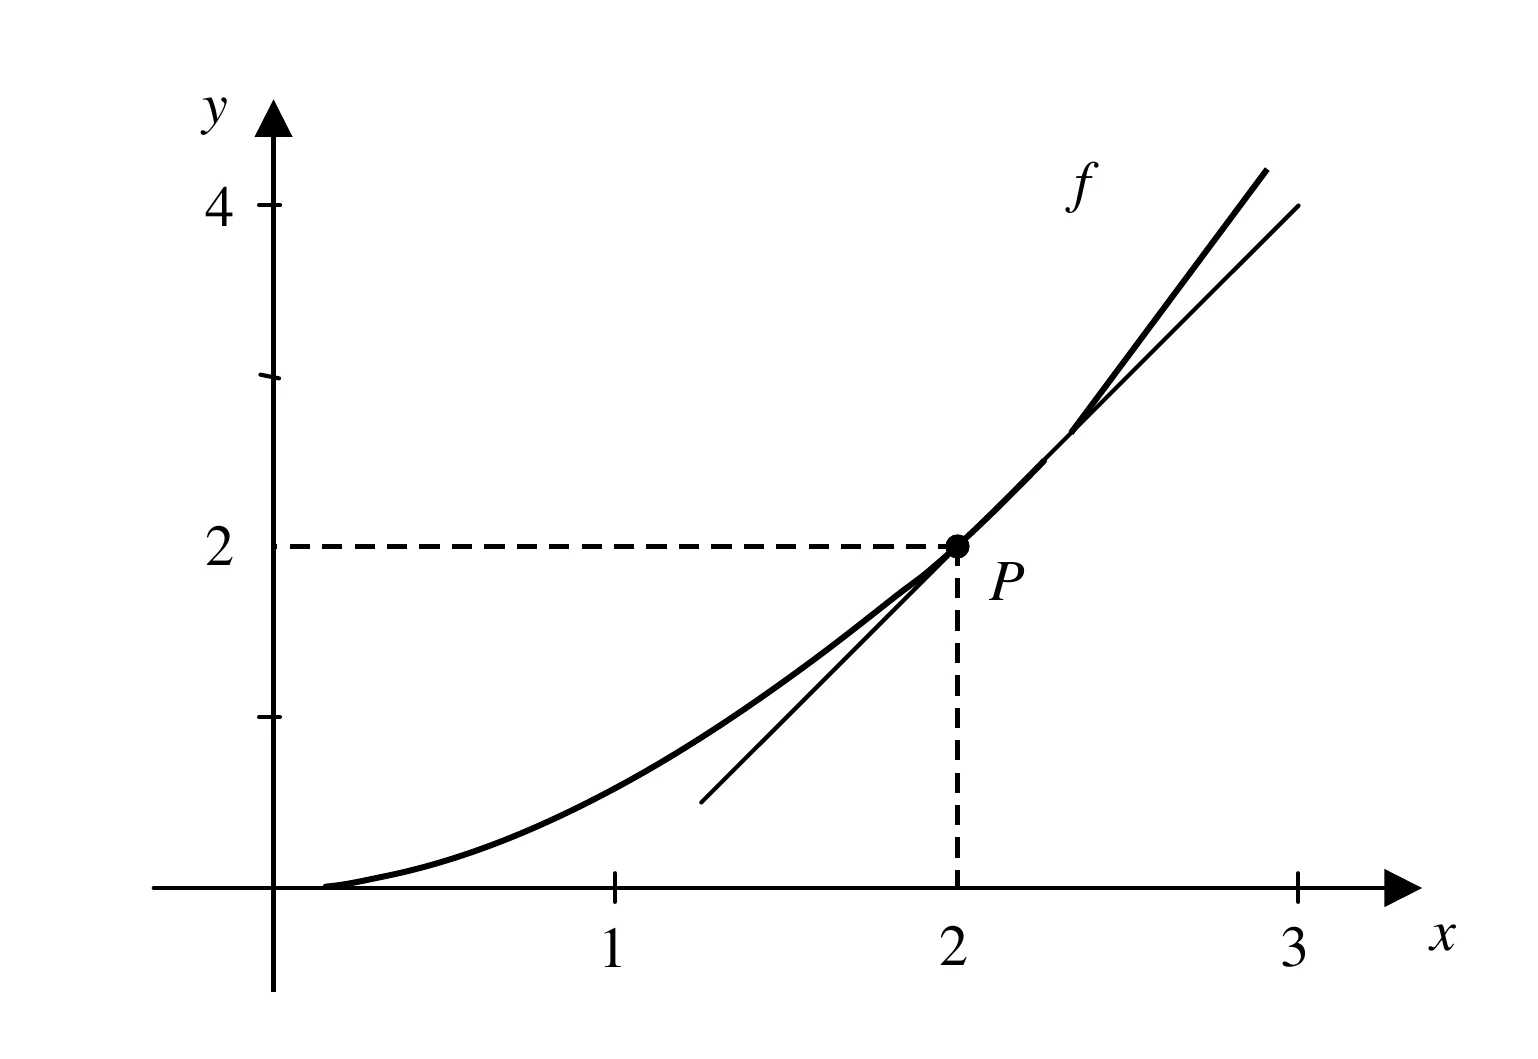
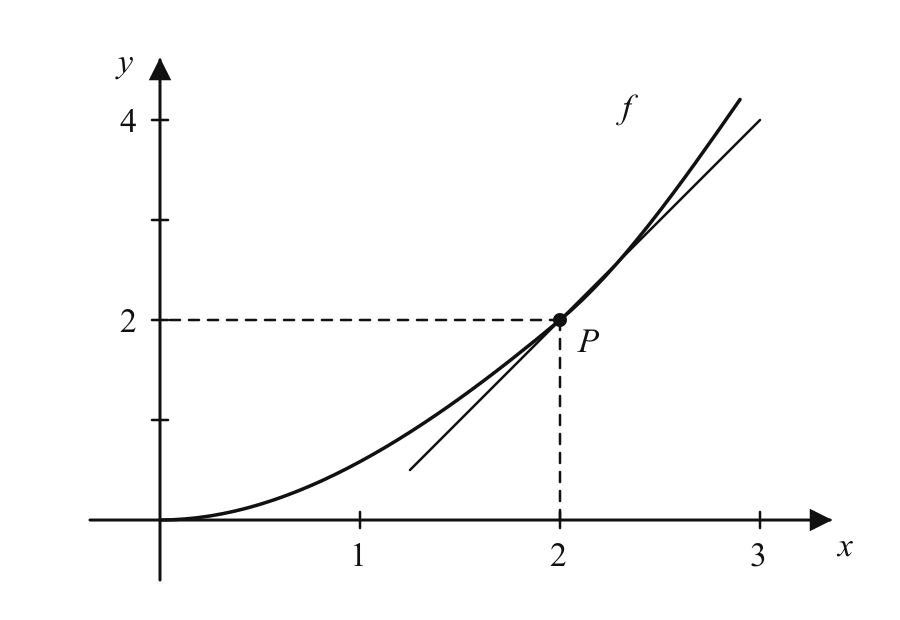
  3. 03A curve and its tangent

    13.1 s 3 credits 9 labels as text

    A curve and its tangent: the picture that went in, a PNG of 900 by 620 pixels.
    Went in PNG, 900 × 620
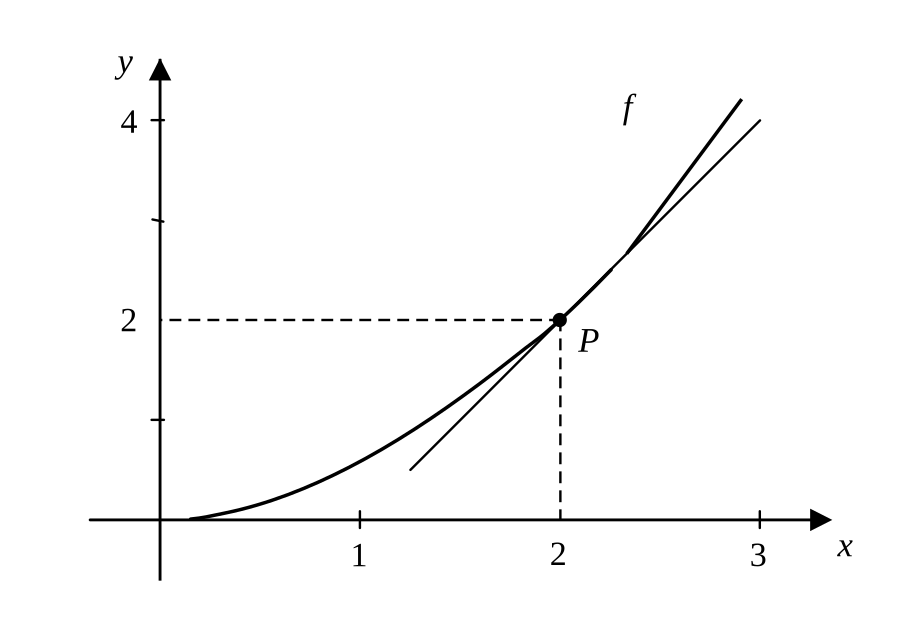
    A curve and its tangent: the TikZ that came back, compiled with pdflatex.
    Came back the TikZ, compiled

    What differs. The curve starts a little to the right of the origin, where it ran along the axis. The two ticks that the dashed lines end on are not drawn on their own, and one tick on the vertical axis is slightly tilted.

    The TikZ, as it came: 28 lines
    \begin{tikzpicture}[line cap=round, line join=round, line width=0.75pt, >={Triangle[length=6.8pt, width=6.9pt, line width=0pt]},
      lbl/.style={inner sep=0pt, outer sep=0pt, anchor=base west, font=\fontsize{10.5}{12.6}\selectfont,
        execute at begin node={\thinmuskip=0mu\medmuskip=0mu\thickmuskip=1mu}}]
    \path[use as bounding box] (0,0) rectangle (9.765,6.723);
    \coordinate (P) at (6.08,3.253);
    \draw[->, line width=0.89pt] (0.978,1.084) -- (9.03,1.084);
    \draw[->, line width=0.89pt, line cap=butt] (1.737,0.425) -- (1.737,6.092);
    \draw[dash pattern=on 3.66pt off 2.2pt, dash phase=0.2pt, line cap=butt] (P) -- (1.737,3.253);
    \draw (8.246,5.418) -- (4.453,1.627);
    \draw[dash pattern=on 3.66pt off 2.2pt, dash phase=0.16pt, line cap=butt] (P) -- (6.08,1.084);
    \node[lbl] at (6.758,5.444) {$f$};
    \node[lbl] at (1.274,5.94) {$y$};
    \node[lbl] at (1.303,3.13) {2};
    \node[lbl] at (9.086,0.69) {$x$};
    \node[lbl] at (6.275,2.909) {$P$};
    \node[lbl] at (8.134,0.584) {3};
    \node[lbl] at (1.306,5.285) {4};
    \node[lbl] at (5.964,0.593) {2};
    \node[lbl] at (3.803,0.582) {1};
    \fill (P) circle[radius=0.077];
    \draw[line width=1.08pt, line cap=butt] (8.047,5.649) -- (6.8,3.973);
    \draw[line width=1.08pt] (2.068,1.093) .. controls (2.192,1.103) and (2.313,1.132) .. (2.435,1.157) .. controls (2.904,1.252) and (3.35,1.431) .. (3.775,1.649) .. controls (4.275,1.904) and (4.743,2.219) .. (5.193,2.553) .. controls (5.366,2.682) and (5.535,2.817) .. (5.706,2.951) .. controls (5.772,3.002) and (5.841,3.049) .. (5.904,3.103) .. controls (6.16,3.32) and (6.397,3.556) .. (6.63,3.797);
    \draw (1.645,5.421) -- (1.778,5.421);
    \draw (1.654,4.344) -- (1.772,4.32);
    \draw (1.645,2.169) -- (1.778,2.169);
    \draw (3.905,1.178) -- (3.905,0.996);
    \draw (8.244,1.178) -- (8.244,0.996);
    \end{tikzpicture}

    The files: the picture, the TikZ (2,055 bytes) and the SVG (3,585 bytes).

  4. 04A control loop

    10 s 3 credits 8 labels as text

    A control loop: the picture that went in, a PNG of 900 by 420 pixels.
    Went in PNG, 900 × 420
    A control loop: the TikZ that came back, compiled with pdflatex.
    Came back the TikZ, compiled

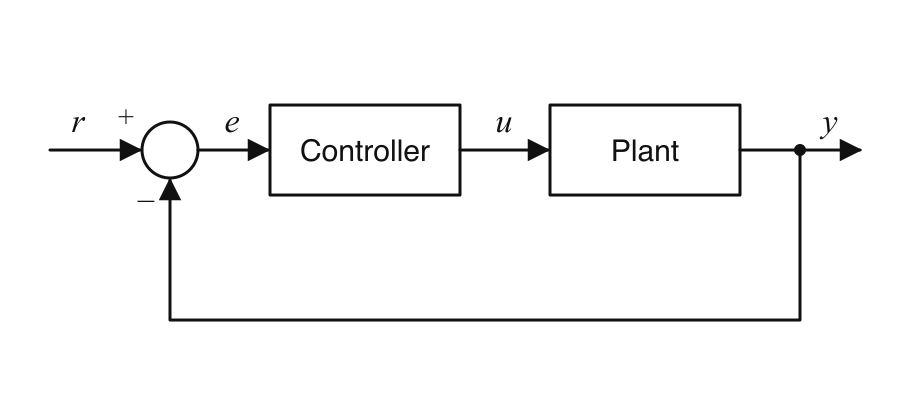
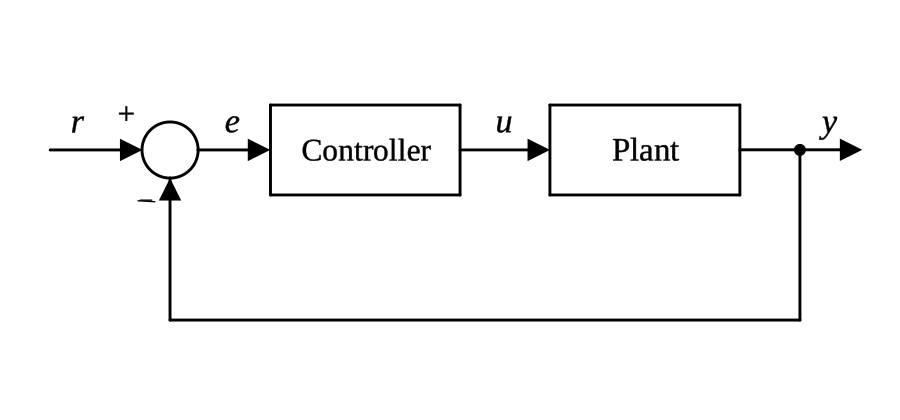
    What differs. The two words in the boxes were set in a sans-serif face and came back in the serif one; each box is four lines, not a rectangle.

    The TikZ, as it came: 31 lines
    \begin{tikzpicture}[line cap=round, line join=round, line width=0.91pt, >={Triangle[length=7pt, width=7pt, line width=0pt]},
      lbl/.style={inner sep=0pt, outer sep=0pt, anchor=base west, font=\fontsize{10.5}{12.6}\selectfont,
        execute at begin node={\thinmuskip=0mu\medmuskip=0mu\thickmuskip=1mu}}]
    \path[use as bounding box] (0,0) rectangle (9.936,4.638);
    \draw (8.832,1.103) -- (1.876,1.103);
    \draw (8.169,2.485) -- (6.071,2.485);
    \draw (5.079,2.485) -- (2.985,2.485);
    \draw (8.169,3.478) -- (6.071,3.478);
    \draw (5.079,3.478) -- (2.985,3.478);
    \draw[->] (8.169,2.984) -- (9.521,2.984);
    \draw[->] (5.079,2.983) -- (6.072,2.983);
    \draw[->] (2.185,2.982) -- (2.982,2.982);
    \draw[->] (0.553,2.982) -- (1.571,2.982);
    \draw (8.832,2.984) -- (8.832,1.103);
    \draw[->] (1.876,1.103) -- (1.876,2.671);
    \draw (6.071,3.478) -- (6.071,2.485);
    \draw (8.169,3.478) -- (8.169,2.485);
    \draw (5.079,3.478) -- (5.079,2.485);
    \draw (2.985,3.478) -- (2.985,2.485);
    \draw (1.877,2.981) circle[radius=0.31];
    \fill (8.832,2.983) circle[radius=0.066];
    \node[lbl, font=\fontsize{9.82}{11.78}\selectfont] at (1.297,3.27) {+};
    \node[lbl] at (9.075,3.176) {$y$};
    \node[lbl] at (0.779,3.176) {$r$};
    \node[lbl] at (5.471,3.179) {$u$};
    \node[lbl] at (2.481,3.178) {$e$};
    \node[lbl, font=\fontsize{8.38}{10.06}\selectfont] at (1.527,2.331) {$-$};
    \node[lbl, font=\fontsize{9.85}{11.81}\selectfont] at (3.327,2.867) {Controller};
    \node[lbl] at (6.757,2.866) {Plant};
    \draw[line width=0.42pt] (1.523,2.421) -- (1.708,2.41);
    \end{tikzpicture}

    The files: the picture, the TikZ (1,794 bytes) and the SVG (4,492 bytes).

Not mock-ups. We drew these four figures for this page and saved each as a PNG, as a figure cut out of a paper is. On 22 November 2026 each PNG was given once to the vectorizer of the image tools; none was tried a second time. The second picture of each pair is what came back: the TikZ file, run through pdflatex (TeX Live 2023) with nothing changed, as a picture of the page it makes. The code and the files are as they came.

Why it is worth having

Code you could have written, not a tracing.

  1. A triangle in its circleThe TikZ, compiled
    The triangle in its circle, as the TikZ that came back draws it: a circle, three sides, a dashed height with its right angle, six labels.
    \draw (C) -- (A) -- (B) -- cycle;
    \draw[dash pattern=on 3.71pt off 1.79pt, dash phase=0.3pt, line cap=butt] (C) -- (H);
    \draw (O) circle[radius=2.374];
    Three lines of its file: the triangle, the dashed height, the circle

    01

    Shapes, not outlines

    A circle comes back as a circle with its radius, a side as a line between two points, a dashed line with its dash pattern, an arrow as a line with an arrowhead. That is the difference to tracing: you can read the file, and change a number in it.

  2. \coordinate (C) at (5.147,4.688);
    \coordinate (A) at (2.018,1.469);
    \coordinate (B) at (6.254,1.469);
    \coordinate (H) at (5.147,1.469);
    \coordinate (O) at (4.136,2.54);
    \draw (C) -- (A) -- (B) -- cycle;
    \draw[dash pattern=on 3.71pt off 1.79pt, dash phase=0.3pt, line cap=butt] (C) -- (H);
    The same file: five points named after their labels, and two lines drawn through them

    02

    Points that carry their names

    In the triangle, the five labelled points came back as coordinates named A, B, C, H and O, and the sides are drawn through them: move one coordinate and the lines that use it follow. The point P of the plot came back the same way.

  3. An automaton with three states7 labels as text
    The automaton as the TikZ that came back draws it: three states named q0, q1 and q2, arrows labelled a and b.
    \node[lbl] at (4.29,2.154) {$q_{1}$};
    \node[lbl] at (1.731,2.162) {$q_{0}$};
    \node[lbl] at (6.857,2.154) {$q_{2}$};
    The names of its three states, as they came: text in math mode, with their subscripts

    03

    Labels that are still text

    Letters come back in math mode, digits and words as text, subscripts as subscripts. You can rename a state or a vertex without redrawing anything, and in your own document the labels take its fonts.

  4. FigureTikZSVGTook
    The two files that came back for each figure, in bytes, and how long each took

    04

    Small files, and an SVG beside each

    Each of the four came back as a TikZ file of 1.3 to 2.3 kilobytes and an SVG of 2.1 to 4.5, in 10 to 18 seconds. The SVG is for the web and for slides; the page of the result also offers it as EPS and as PNG.

How it works

Three steps from a picture to your paper.

  1. 01

    Save the figure as a picture

    A screenshot of a figure, or an export from a drawing program: a PNG, JPG or WebP of up to 20 MB. It is meant for drawings, charts and diagrams; a photograph is not what it is for.

  2. 02

    Open the vectorizer and add it

    In the image tools, choose Vectorize and add the picture. It costs 3 credits, charged when the drawing is done. The four on this page took 10 to 18 seconds each.

  3. 03

    Download the TikZ, or the SVG

    The TikZ file is a small document of its own that compiles as it is. For your paper, copy its tikzpicture into your document; the second line of the file says which packages that needs. The SVG, an EPS and a PNG are on the same page.

The fine print

What it takes and what it gives back.

Better to know before you start. The last list is what it does not do today.

Takes
A PNG, JPG or WebP of up to 20 MB
Meant for
Drawings, charts and diagrams. Photographs are not what it is for
Gives back
An SVG of the drawing and, where it can be had, the same drawing as TikZ
The TikZ file
A document of its own (the standalone class, TikZ, the newtx fonts) that compiles as it is. Its second line says what the drawing needs in your own document: \usepackage{tikz}, and \usetikzlibrary{arrows.meta} when it has arrows. We pasted the four drawings into a plain article that loads those two and nothing else, and it compiled
Shapes
In the four figures here: lines, circles, arcs, curves, dashed lines with their pattern, arrowheads, filled dots
Labels
In the four figures here all 30 came back as text: letters in math mode, digits, words, subscripts. The file sets them in a serif face whatever the picture used; in your document they take its fonts
Other files
On the page of the result: the SVG as EPS (made in your browser, which says what it could not carry over) and as PNG
How long it takes
The four figures here: 10 to 18 seconds each
Cost
3 credits a picture on every plan, charged when the drawing is done
Storage
Pictures and results are kept for 31 days, then deleted. You can delete them sooner

Not a fit yet

  • A photograph. It is for drawings, charts and diagrams.
  • TikZ for every picture. The SVG is the result; TikZ comes with it where it can be had.
  • A flawless copy. Look at the four figures above: a stray stroke beside an arrowhead, a curve that starts a little late. Check a figure before it goes into a paper.
  • Shapes named for what they are. A box came back as four lines, not as a rectangle, and the automaton as circles and arrows, not as states and edges.
  • The typeface of the picture. A label set in a sans-serif face comes back as text in the serif one.
  • Sketches drawn by hand are not shown here: the four figures were drawn on a computer, and we have not measured sketches.

Questions

Questions people ask first.

Something else on your mind? The help center goes deeper.

How do I convert an image to TikZ?

Open the image tools, choose Vectorize and add a PNG, JPG or WebP of the figure. When the drawing is done, download the TikZ, and the SVG if you want it. The four figures on this page took 10 to 18 seconds each.

Does the TikZ compile?

The four files on this page compiled as they came, with pdflatex from TeX Live 2023; each can be downloaded here and tried. A file is a document of its own: the standalone class with TikZ and the newtx fonts. Its second line says what its drawing needs in your own document: \usepackage{tikz}, and \usetikzlibrary{arrows.meta} when it has arrows.

Is it free?

The free plan gives you 50 credits every month and needs no card. A figure costs 3 credits, so a month of the free plan covers 16 figures.

Can I edit the result?

That is what it is for. Shapes come back as shapes (a circle with a radius, a line between two points), labelled points can come back as named coordinates, and labels are text. Change a coordinate, a radius or a label, and compile again.

Do the labels survive?

In the four figures on this page all 30 labels came back as text: letters in math mode, digits, two words and three subscripts. The file sets them in a serif face whatever the picture used, and in your own document they take its fonts.

How is this different from tracing a bitmap?

A tracer follows the edge of the ink and gives you outlines: a circle becomes a path of many points, and a letter becomes a shape. Here a circle came back as a circle with a radius, an arrow as a line with an arrowhead, and a letter as a letter. The drawings are short enough to read: 25 to 31 lines for the figures on this page.

Can I get SVG, EPS or a PDF instead?

Every result is an SVG, which stays sharp at any size. The page of the result also offers it as EPS (made in your browser, with a note of anything it could not carry over) and as PNG. For a PDF, compile the TikZ file: it is a document of its own.

Does it work on photographs or hand-drawn sketches?

It is meant for drawings, charts and diagrams; photographs are not what it is for. The figures on this page were drawn on a computer, and we have not measured sketches drawn by hand.

How long are my pictures kept?

For 31 days, then they are deleted automatically. You can delete them sooner.

Bring the figure you would otherwise redraw by hand.

Start on the free plan. No card needed.