PDF to Excel with numbers you can add up.
Upload a PDF and get its tables back as one Excel workbook: a sheet for each table, merged headings still merged, and every figure a number, not text. A report with three tables was converted for this page, as a PDF and as a scan. The workbook that came back is further down, to open.
No file at hand? See a page before and after
- From
- A PDF, digital or scanned, or a picture of a page
- Back
- One .xlsx workbook, a sheet for each table. Word, Markdown and LaTeX from the same conversion
- Cost
- A quarter of a credit a page: about 200 pages a month on the free plan
Before and after
The table, as a sheet.
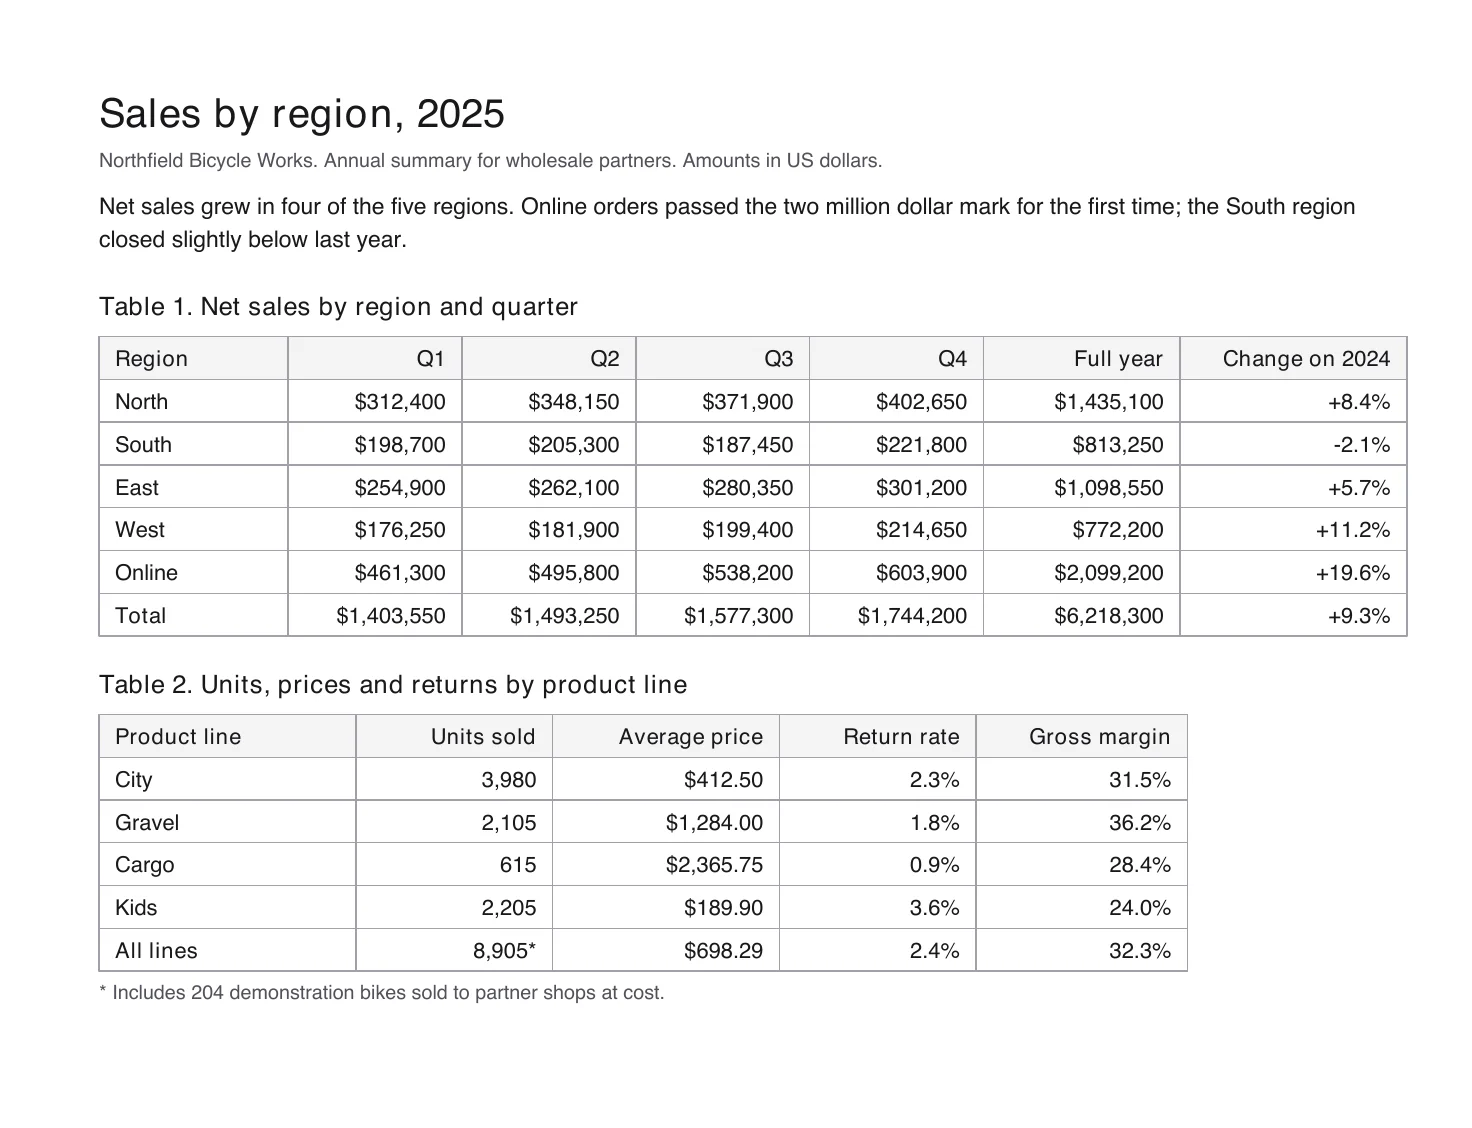
Drag the handle. Left of it is a page of a sales report as it was uploaded. Right of it is the first sheet of the workbook that came back, the way a spreadsheet shows it: numbers to the right, text to the left.
- 01Every amount is a number: $312,400 is 312400, shown with its dollar sign and its comma.
- 02The percentages are numbers too: +8.4% is 0.084, shown as a percentage with its sign.
- 03The workbook has three sheets, one for each table of the two pages.
| A | B | C | D | E | F | G | |
|---|---|---|---|---|---|---|---|
| 1 | Region | Q1 | Q2 | Q3 | Q4 | Full year | Change on 2024 |
| 2 | North | $312,400 | $348,150 | $371,900 | $402,650 | $1,435,100 | +8.4% |
| 3 | South | $198,700 | $205,300 | $187,450 | $221,800 | $813,250 | -2.1% |
| 4 | East | $254,900 | $262,100 | $280,350 | $301,200 | $1,098,550 | +5.7% |
| 5 | West | $176,250 | $181,900 | $199,400 | $214,650 | $772,200 | +11.2% |
| 6 | Online | $461,300 | $495,800 | $538,200 | $603,900 | $2,099,200 | +19.6% |
| 7 | Total | $1,403,550 | $1,493,250 | $1,577,300 | $1,744,200 | $6,218,300 | +9.3% |
Not a mock-up. The sheet is the first of the 3 sheets of the workbook Doc2X returned for this report on 18 November 2026, as a spreadsheet library reads the file: every cell is the one in the download, nothing is retyped. Open the PDF that went in and the Excel workbook that came back.
Why it is a spreadsheet, not a picture of one
Tables you can work in.
The pagePDF · table 1 A B C D E F G 1 Region Q1 Q2 Q3 Q4 Full year Change on 2024 2 North $312,400 $348,150 $371,900 $402,650 $1,435,100 +8.4% 3 South $198,700 $205,300 $187,450 $221,800 $813,250 -2.1% 4 East $254,900 $262,100 $280,350 $301,200 $1,098,550 +5.7% 5 West $176,250 $181,900 $199,400 $214,650 $772,200 +11.2% 6 Online $461,300 $495,800 $538,200 $603,900 $2,099,200 +19.6% 7 Total $1,403,550 $1,493,250 $1,577,300 $1,744,200 $6,218,300 +9.3% The same table in the workbook that came back. The five regions of Q1 add up to $1,403,550: the total the report prints in B7 01
Numbers that add up
A spreadsheet can only add what it holds as numbers. In the three sheets, 70 cells are numbers: every figure of the report that is only a number. Add the five regions of the first quarter and you get $1,403,550, the total the report prints under them.
The pagePDF · table 2 A B C D E 1 Product line Units sold Average price Return rate Gross margin 2 City 3,980 $412.50 2.3% 31.5% 3 Gravel 2,105 $1,284.00 1.8% 36.2% 4 Cargo 615 $2,365.75 0.9% 28.4% 5 Kids 2,205 $189.90 3.6% 24.0% 6 All lines 8,905* $698.29 2.4% 32.3% Sheet 2 of the workbook. Numbers sit to the right; 8,905* in B6 is text and sits to the left 02
What is not a number stays text
One cell of the report carries a footnote mark: 8,905*. That is more than a number, so it is not turned into one behind your back. It arrives as the text it is, for you to decide. A cell with a unit, a range or brackets is treated the same way.
The pagePDF · page 2 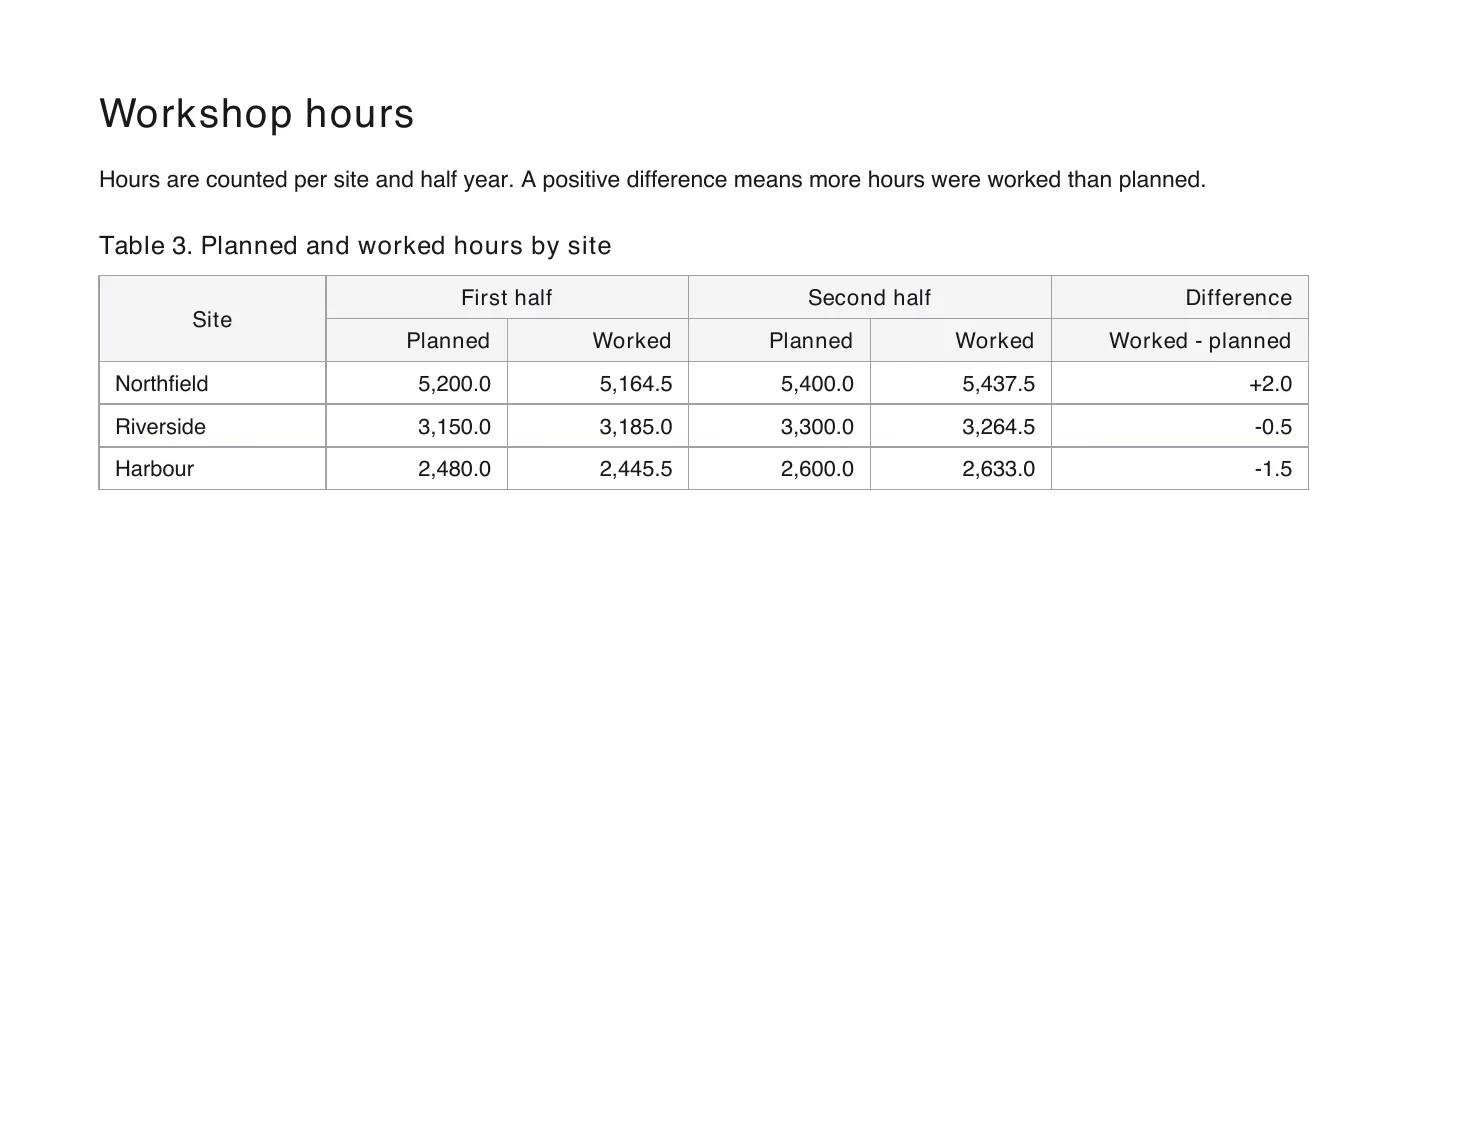
A B C D E F 1 Site First half Second half Difference 2 Planned Worked Planned Worked Worked - planned 3 Northfield 5,200.0 5,164.5 5,400.0 5,437.5 +2.0 4 Riverside 3,150.0 3,185.0 3,300.0 3,264.5 -0.5 5 Harbour 2,480.0 2,445.5 2,600.0 2,633.0 -1.5 Table 1 (p1)Table 2 (p1)Table 3 (p2)Sheet 3 of the workbook: A1:A2, B1:C1 and D1:E1 are merged cells, as on the page 03
Merged headings stay merged
The third table has a heading over two rows: First half and Second half each span two columns. In the sheet they are merged cells in the same places, and the columns under them line up as on the page.
The scanPDF · image only 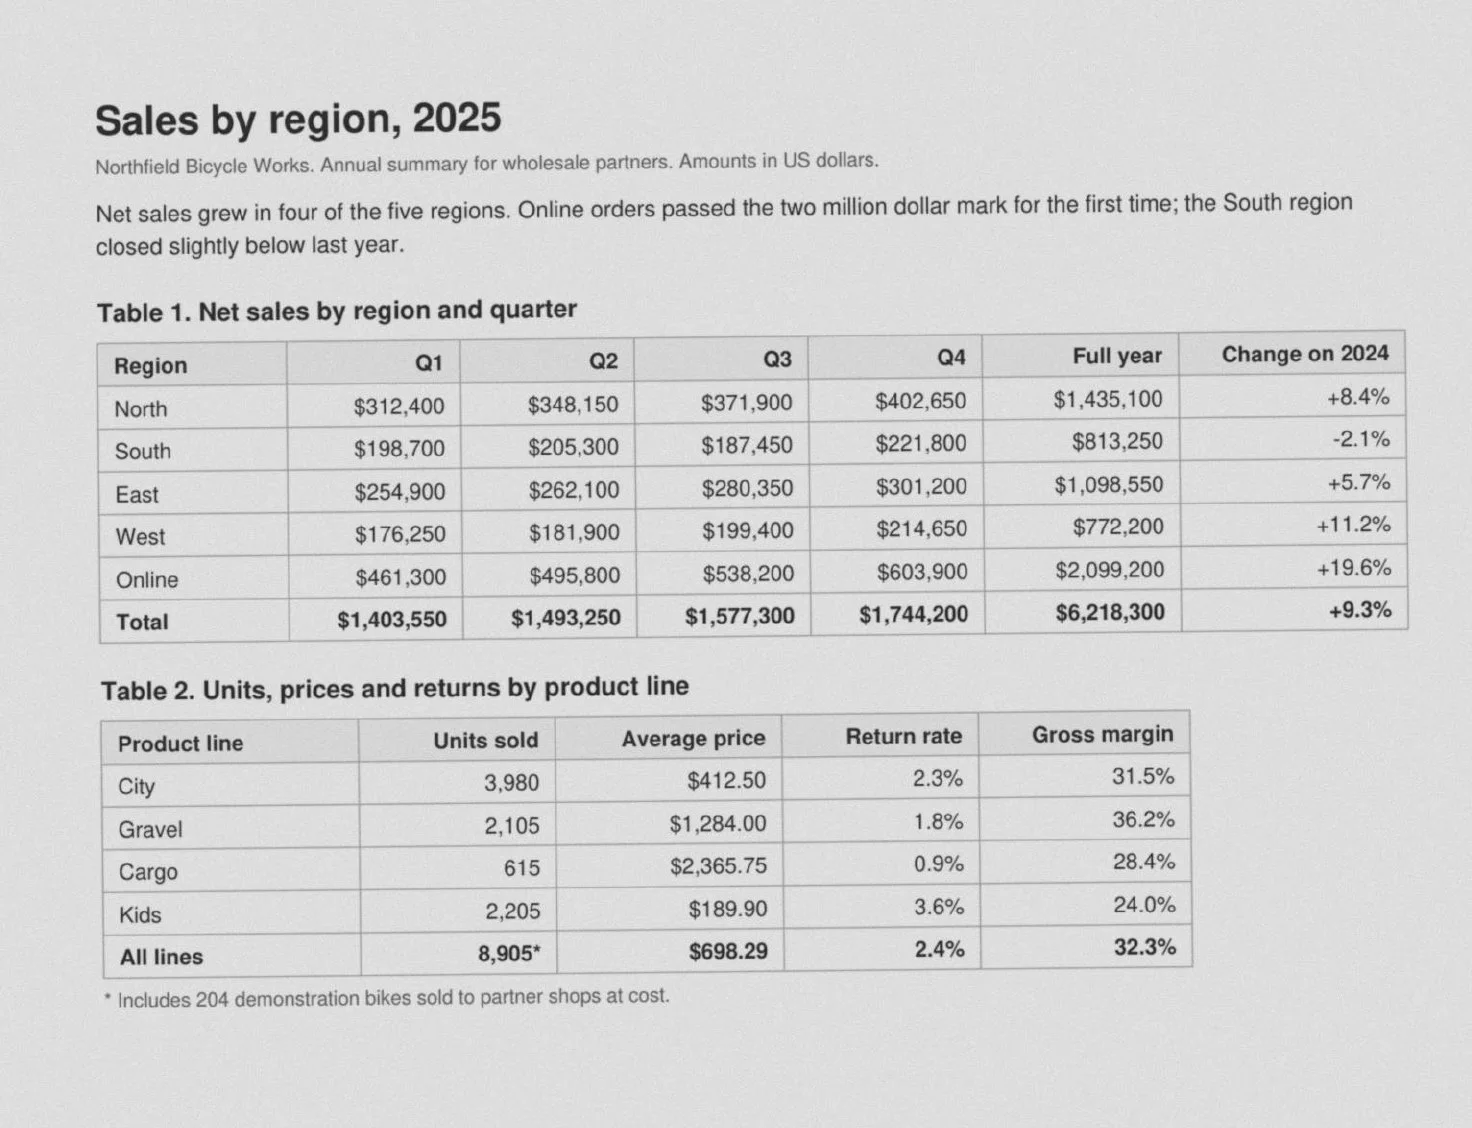
A B C D E F G 1 Region Q1 Q2 Q3 Q4 Full year Change on 2024 2 North $312,400 $348,150 $371,900 $402,650 $1,435,100 +8.4% 3 South $198,700 $205,300 $187,450 $221,800 $813,250 -2.1% 4 East $254,900 $262,100 $280,350 $301,200 $1,098,550 +5.7% 5 West $176,250 $181,900 $199,400 $214,650 $772,200 +11.2% 6 Online $461,300 $495,800 $538,200 $603,900 $2,099,200 +19.6% 7 Total $1,403,550 $1,493,250 $1,577,300 $1,744,200 $6,218,300 +9.3% Sheet 1 of the workbook that came back for the scan. All 79 cells of its two sheets are the same as from the PDF 04
A scan gives the same workbook
The first page was also converted as a scan: an image with no text in it, grey, soft and slightly turned. Its two tables came back as the same two sheets: all 79 cells hold the same number or the same text as from the PDF.
How it works
Three steps from PDF to workbook.
01
Add the PDF
Drop it into the box at the top of this page. Nothing is uploaded before you start, and the workbench shows the total first: a quarter of a credit a page.
02
Convert, and look at it
The result opens as text beside the PDF, its tables as tables. From the click on Convert to the open result, the two-page report on this page took 11 seconds and the scan of its first page 11.
03
Download the workbook
Open the download dialog: it is already on Tables (Excel) when you come from this page. One click, and the workbook is put together in your browser from the tables you just looked at.
The fine print
What it takes and what it gives back.
Better to know before you upload. The last list is what it does not do today.
- Files
- PDF, digital or scanned. A picture of a page (PNG, JPG or WebP) is taken too and goes in as a one-page PDF
- File size
- 20 MB on Free, 200 MB on Starter, 500 MB on Pro
- Result
- One .xlsx workbook. A document with one table gives one sheet; with several, a sheet for each, named after the table and its page: Table 3 (p2)
- Numbers
- A cell that is only a number is a number, shown as the document shows it: its decimals, its thousands separators, a percent sign, a dollar, euro, pound or yen sign, a plus sign that was written
- Stays text
- A cell with anything more than a number: a footnote mark, a unit, a range, brackets, a date. Also a number with zeros in front, a number of more than 15 digits, and a year in the heading of a table
- Formulas in a cell
- Written into the cell as text, the way one would type them: O(n² · d), 10⁻³, xᵢ, (a+b)/c. A formula that cannot be typed that way stays in the cell as its LaTeX source. Nothing is drawn over the sheet: what a cell says is in the cell
- Decimal commas
- A table that writes 12,5 and 1.234,56 is read that way as a whole: there, 1.234 is one thousand two hundred and thirty-four
- Merged cells
- A cell that spans rows or columns is a merged cell in the sheet
- Where it is made
- The tables are read on our servers, as part of the conversion. The workbook is put together from them in your browser
- Other formats
- Word, Markdown, LaTeX, Typst and a web page from the same conversion, on every plan
- Cost
- A quarter of a credit a page; the total is shown before you start. The free plan has 50 credits a month, about 200 pages. The workbook costs nothing more. A conversion that fails is not charged.
- Storage
- Uploaded files and results are deleted automatically within 31 days
Not a fit yet
- Negative amounts written in brackets, the way accounts print them. (1,234) arrives as text, not as minus 1,234.
- Spreadsheet formulas. The workbook holds the values the document prints: a total is the printed total, not a SUM.
- The look of the table. The sheet has the cells and their merges, not the fonts, colours and rules of the page.
- Charts. A chart in the PDF comes back as a picture in the document and is not in the workbook.
- Excel files as input. This turns a PDF into a workbook, not the other way round.
How do I convert a PDF to Excel?
Add the PDF to the box on this page and start the conversion. Doc2X reads the document, tables included, and shows you the result. In the download dialog, Tables (Excel) gives you one workbook with a sheet for each table.
Does it work on a scanned PDF?
Yes. The first page of the report on this page was also converted as a scan, an image with no text in it. Its two tables came back as the same two sheets as from the PDF, all 79 cells alike. Both workbooks are on this page to open.
Do the numbers arrive as numbers, or as text?
As numbers. A cell that is only a number is written as that number and shown the way the document shows it, with its decimals, thousands separators, percent sign or currency symbol. A cell with anything more, like a footnote mark or a unit, stays text, so nothing is changed behind your back.
Do I get one file or one for each table?
One workbook. Each table of the document is a sheet of it, named after the table and the page it is on.
What happens to merged cells?
A cell that spans rows or columns on the page is a merged cell in the sheet. In the sample on this page the heading of the third table spans two rows and two columns, and so does the sheet.
Is it free?
The free plan gives you 50 credits every month and needs no card. A page costs a quarter of a credit, so about 200 pages a month. The total is shown before you start, the workbook costs nothing more, and a conversion that fails is not charged.
Can I get the rest of the document too?
Yes. The same conversion gives the whole document as Word, Markdown, LaTeX, Typst or a web page, tables and text together. The workbook is the tables on their own.
What happens to my file?
It is uploaded over an encrypted connection, used to produce your conversion, and deleted automatically within 31 days. Unless you explicitly agree, your files are not used to train AI models offered to the public or to other customers.
Get the numbers out of the PDF.
Start on the free plan. No card needed.